
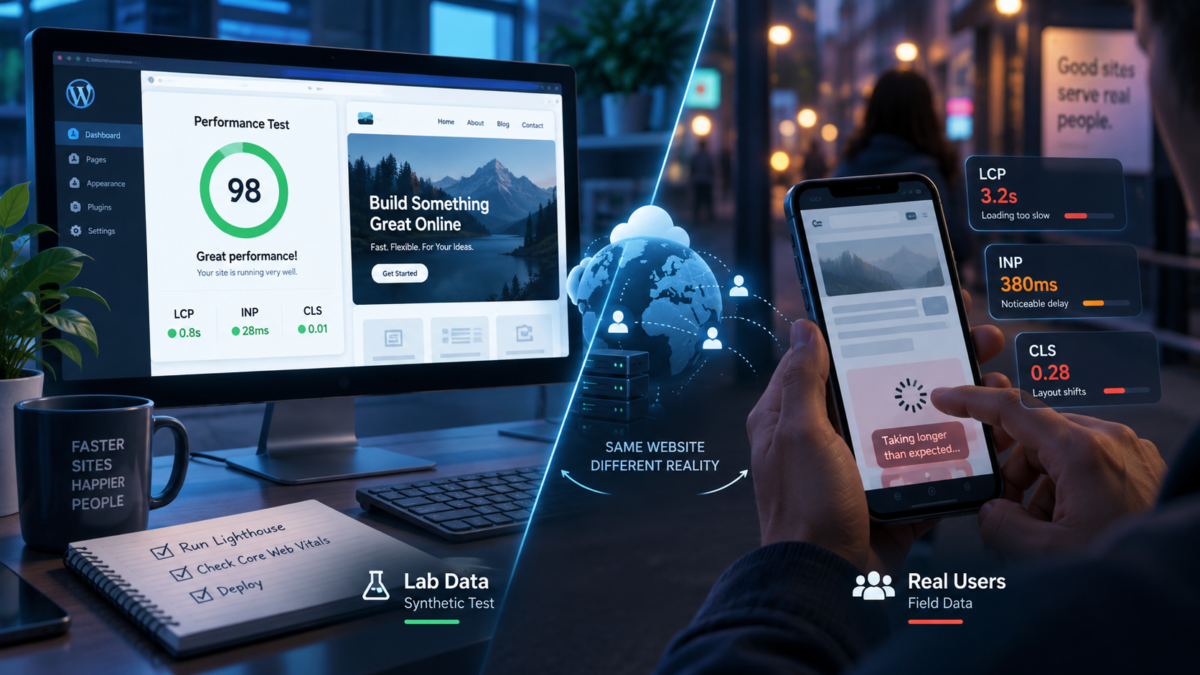
A WordPress website can look fast in a controlled test and still feel slow to the people who actually use it. A PageSpeed Insights run may show an excellent Lighthouse score, a developer may see a sub-second cached response on a fast connection, and yet Google Search Console can continue to report Core Web Vitals problems.
This is not necessarily a contradiction. The tools are measuring different things, under different conditions, for different purposes.
Core Web Vitals are most useful when they are treated as evidence about real user experience rather than as a score to maximize. For WordPress sites in particular, understanding that distinction matters because caching, themes, plugins, third-party scripts, image handling and server behaviour can produce very different results between a laboratory test and a real visit.
What Core Web Vitals actually measure
The current Core Web Vitals focus on three different parts of the user experience: loading, responsiveness and visual stability.
| Metric | What it measures | Good threshold |
|---|---|---|
| LCP | How quickly the main visible content is rendered | 2.5 seconds or less |
| INP | How quickly the page responds visually to user interactions | 200 milliseconds or less |
| CLS | How stable the page layout remains while content loads | 0.1 or less |
The recommended targets are evaluated at the 75th percentile of page visits. That detail is important. Core Web Vitals are not asking whether one ideal test was fast; they are asking whether the experience is good for most users.
Largest Contentful Paint (LCP)
Largest Contentful Paint measures when the largest qualifying image, text block or other content element visible in the initial viewport is rendered. On WordPress sites this is often a hero image, a featured image, a large heading or a prominent content block.
A slow LCP is therefore not simply an “image problem.” It can begin long before the browser downloads the LCP element. DNS resolution, connection setup, redirects, server response time, HTML generation, render-blocking CSS, font loading and resource prioritization can all delay the moment at which the main content becomes visible.
Interaction to Next Paint (INP)
Interaction to Next Paint measures responsiveness throughout the life of the page. It observes interactions such as clicks, taps and keyboard input and evaluates how long the browser takes before it can present the next visual frame.
This makes INP particularly relevant to modern WordPress sites. A page may load quickly and still respond poorly when a visitor opens the mobile menu, changes a filter, submits a form, accepts a cookie banner or interacts with a page-builder component.
JavaScript is often involved, but file size alone does not explain INP. The more important question is how much work blocks the browser’s main thread at the moment the user tries to interact.
Cumulative Layout Shift (CLS)
Cumulative Layout Shift measures unexpected movement of visible elements. A page can appear to load quickly but still be frustrating if text, buttons or navigation move after the user begins reading or interacting.
Typical WordPress causes include images without reserved dimensions, late-loading fonts, advertising or embed containers, cookie notices, dynamically injected widgets and theme components whose final size is not known when the initial layout is calculated.
A Lighthouse score is not the same as Core Web Vitals
This is one of the most important distinctions in website performance work.
Lighthouse performs a controlled laboratory test. It loads a page under simulated conditions and reports what happened during that specific run. The result is extremely useful for debugging because the environment is repeatable and the report can identify render-blocking resources, long tasks, unused code and other technical opportunities.
Core Web Vitals field data answers a different question: what happened to real users?
Google’s Chrome User Experience Report, commonly called CrUX, aggregates performance observations from eligible real-world Chrome visits. The Search Console Core Web Vitals report is based on real-user data rather than a single synthetic page load.
Those visitors do not all use the same desktop computer, network connection or browser state. Some use mid-range phones. Some arrive through mobile networks. Some load the site with an empty cache. Some encounter third-party services responding slowly. Some interact with parts of the page that a Lighthouse run never touches.
That is why a site can achieve a very high Lighthouse score and still have Core Web Vitals problems in the field.
Why PageSpeed Insights and Search Console can disagree
PageSpeed Insights can show both field and lab information, but those datasets should not be treated as interchangeable.
- Lab data describes one synthetic test under defined conditions.
- Field data represents aggregated experiences from real users.
- Search Console groups similar URLs and evaluates Core Web Vitals using real-user data over time.
- A current optimization may improve today’s test immediately while historical field data still contains visits from before the fix.
The Search Console Core Web Vitals report uses measurements from real users over a rolling 28-day period. For each URL group, Google reports the 75th percentile for LCP, INP and CLS — in other words, the value that 75% of measured page visits met or performed better than.
This delay often creates unnecessary troubleshooting. A site owner improves an LCP problem, reruns Lighthouse, receives a green result and assumes Search Console should change the same day. When it does not, another optimization plugin gets installed, more JavaScript is delayed and the configuration becomes increasingly complicated.
The better response is to verify that the technical cause has actually been fixed and then allow new field data to replace the older observations.
Why a WordPress site can score 100 and still have real performance problems
A perfect or near-perfect Lighthouse score can be useful evidence that a tested page behaves efficiently under the test conditions. It is not proof that every visitor receives the same experience.
A warm cache can hide expensive WordPress processing
Page caching can turn an expensive WordPress request into a very fast static response. That is exactly what a cache is designed to do.
But the first request after publication, cache expiration or invalidation may still require WordPress core, the theme and active plugins to execute, query the database and generate the page. If that uncached path takes several seconds, some visitors may experience a very different LCP from a repeated benchmark.
This is why performance testing should include both cached and uncached behaviour. A cache can reduce the frequency of expensive processing without fixing the processing itself.
Real phones are not developer workstations
Performance bottlenecks often become more visible on mobile hardware. JavaScript that appears insignificant on a powerful desktop processor can occupy the main thread much longer on a mid-range phone.
The same applies to image decoding, layout calculations, large DOM trees and complex visual effects. A design approved on a fast office connection may behave very differently for the audience that matters.
Third-party scripts are variable
Analytics, consent systems, advertising, embedded media, chat widgets, maps and marketing tools introduce dependencies outside the WordPress server.
A laboratory test may catch them at a good moment. Real visitors experience them across thousands of network and device combinations. The impact may also depend on consent state, geographic region or previous browser storage.
LCP problems in WordPress: find the delay before optimizing the image
When LCP is poor, the first reaction is often to compress the largest image. Sometimes that is correct. Often it addresses only one part of the delay.
A useful LCP investigation separates the loading path into stages.
- Server response: how long does it take before the browser begins receiving the HTML?
- Resource discovery: how quickly can the browser discover the LCP resource?
- Resource loading: how long does the image, font or other resource take to transfer?
- Rendering: after the resource is available, what prevents the browser from painting it?
For a WordPress featured image, common mistakes include serving an unnecessarily large source file, using inefficient formats, lazy-loading the above-the-fold image, discovering it late through CSS or JavaScript, or failing to give it appropriate loading priority.
But if Time to First Byte is already several seconds, converting the image from JPEG to AVIF cannot recover the time spent waiting for WordPress to produce the document.
The optimization has to match the bottleneck.
INP problems in WordPress: the page can load fast and still feel broken
INP changes the performance conversation because it continues measuring after the initial page load.
Consider a WordPress site that reaches a visually complete state quickly but loads several JavaScript bundles for a page builder, menu system, analytics platform, consent manager and interactive form. The initial appearance may be excellent. A visitor then taps the mobile navigation while the browser’s main thread is busy, and the menu does not open immediately.
That delay is a real usability problem even though the page “loaded fast.”
When diagnosing INP, inspect what happens around slow interactions rather than simply sorting JavaScript files by size.
- Look for long main-thread tasks.
- Identify expensive event handlers.
- Check whether one interaction triggers large DOM updates.
- Test mobile menus, forms, filters and consent controls.
- Review third-party JavaScript execution.
- Remove or conditionally load functionality that is not required on the page.
INP is also a good example of why automated optimization settings require caution. Delaying JavaScript indiscriminately can improve one synthetic metric while breaking navigation, consent handling, forms or analytics.
CLS problems in WordPress: reserve space before content arrives
Many CLS issues are conceptually simple: the browser initially lays out the page without knowing how much space an element will need, and the element later pushes surrounding content into a new position.
WordPress itself provides width and height information for many images, but themes, builders, custom templates and dynamically inserted components can still remove or override that stability.
Typical areas to inspect include:
- hero and featured images;
- responsive embeds and iframes;
- cookie consent banners;
- advertising containers;
- web fonts that substantially change text dimensions;
- late-loaded headers or announcement bars;
- sliders and galleries whose initial height is unknown;
- third-party widgets inserted above existing content.
The goal is not to stop pages from changing. User-initiated changes are normal. The problem is unexpected movement that happens while somebody is trying to read or interact.
How WordPress themes and plugins affect Core Web Vitals
Performance problems are rarely explained by plugin count alone. Twenty focused plugins can have less impact than one feature-heavy component that performs database work, loads global assets and initializes large JavaScript frameworks on every page.
The same applies to themes. A visually rich theme is not automatically slow, and a minimal-looking theme is not automatically efficient. What matters is the work performed for the actual page.
This is closely related to WordPress technical debt. Features accumulate over time: a builder remains because one landing page depends on it, an old slider loads scripts everywhere, a plugin is retained for a shortcode used in two posts, and another optimization plugin is added to compensate for the combined cost.
At that point the performance problem is architectural rather than a missing checkbox in a caching plugin.
Core Web Vitals are also a technical SEO diagnostic
Core Web Vitals should not be confused with the whole of technical SEO. A fast page can still have canonical mistakes, broken internal links, accidental noindex directives, crawl problems or duplicate content.
Conversely, technically indexable content can still provide a poor experience if the page is slow, unstable or unresponsive.
This is why performance belongs inside a broader technical audit. In Why Good Content Can Still Rank Poorly: Technical SEO Problems Website Owners Miss, the central issue is similar: content quality cannot compensate for every technical obstacle around the content.
Core Web Vitals add another layer of evidence by showing whether important aspects of the user experience remain reliable outside the developer’s machine.
Do Core Web Vitals affect SEO rankings?
Page experience matters in Google Search, but reducing the relationship to “better Core Web Vitals equals better rankings” is misleading.
Google’s documentation on Core Web Vitals and Search explains that Core Web Vitals are used by ranking systems, while also emphasizing that achieving good results does not guarantee top rankings. Relevance and useful content remain fundamental.
A technically perfect page does not deserve a top position simply because its LCP is fast, and a relevant, authoritative result does not automatically disappear because one performance metric is slightly outside the recommended range.
The practical business case for Core Web Vitals is stronger than the ranking-factor argument anyway.
A page that presents important content quickly, responds when people interact and does not move controls underneath their fingers is simply easier to use. Those improvements can support engagement, conversions and trust regardless of how much direct ranking weight any individual metric receives.
How to diagnose Core Web Vitals on a WordPress site
A useful audit moves from evidence to cause instead of from plugin setting to plugin setting.
1. Start with field data
Check whether PageSpeed Insights or the Search Console Core Web Vitals report has sufficient real-user data. Determine which metric is failing and whether the problem affects mobile, desktop or both.
Search Console groups similar URLs, so do not assume every URL in a group has exactly the same underlying problem. Use the report to identify patterns and then test representative pages directly.
2. Use lab tools to reproduce the problem
Lighthouse and browser developer tools are valuable because they expose details that aggregate field reports cannot: request waterfalls, main-thread activity, resource priority, layout shifts, long tasks and rendering dependencies.
The lab test is therefore not competing with field data. It is a diagnostic environment used to explain it.
3. Test more than the homepage
WordPress sites have multiple templates with different workloads. Test representative examples of:
- homepage;
- blog post;
- standard page;
- category or archive page;
- contact page and forms;
- search results;
- shop or checkout pages where relevant;
- custom post types and landing pages.
A homepage optimized to perfection tells you little about a post template that loads a different gallery, comment system or advertising stack.
4. Compare cached and uncached requests
If a cache is active, measure both states. A cached result shows the experience when the optimization layer is working. An uncached request reveals how expensive the underlying WordPress application remains.
Large differences between the two often indicate database, plugin, API or server-side work that deserves investigation even if most visitors eventually receive cached HTML.
5. Test important interactions manually
Do not stop when the loading trace turns green. Open the menu. Use the search. Accept or reject consent. Submit forms. Change filters. Expand accordions. Interact with the site on a realistic mobile viewport.
This is especially important for INP because a page-load benchmark cannot reproduce every real interaction automatically.
A practical WordPress performance testing workflow
No single performance tool answers every useful question. Search Console, PageSpeed Insights, GTmetrix, Chrome DevTools and a direct TTFB measurement can all produce different numbers without any of them necessarily being wrong.
The important step is to decide what you are trying to measure before interpreting the result.
| Question | Tool | What it is useful for |
|---|---|---|
| Are real users experiencing a Core Web Vitals problem? | Search Console / CrUX | Field LCP, INP and CLS collected from eligible real Chrome users over time |
| Can the problem be reproduced in a controlled test? | PageSpeed Insights / Lighthouse | Synthetic loading diagnostics, rendering opportunities and repeatable lab measurements |
| Does geography or network quality change the result? | GTmetrix | Controlled tests with selected locations, devices and connection profiles |
| Which request is slow or discovered too late? | Chrome DevTools → Network | Request waterfall, timing, priority, headers, caching and resource dependencies |
| What happens on the main thread during loading or interaction? | Chrome DevTools → Performance | LCP, CLS, INP, interactions, long tasks, rendering and layout activity |
| Is the initial response or cache path slow? | curl / TTFB test | Direct comparison of time to first byte between requests and cache states |
This sequence prevents a common mistake: treating every speed test as if it measures the same environment and the same part of the loading process.
Use Search Console and CrUX to identify real-user problems
If enough field data exists, start with the Search Console Core Web Vitals report. It can show whether LCP, INP or CLS is affecting groups of similar URLs and whether the problem appears on mobile, desktop or both.
This is the evidence that matters when the question is whether real visitors have actually experienced a Core Web Vitals problem. It is not, however, a detailed debugging trace. Once a pattern has been identified, another tool is usually needed to reproduce and explain it.
Use PageSpeed Insights and Lighthouse as a controlled diagnostic test
PageSpeed Insights combines available field information with a Lighthouse laboratory test. The Lighthouse part is useful because it provides a repeatable environment in which resource loading, rendering and other technical opportunities can be inspected.
One detail is easy to overlook: the geographic location of the person opening PageSpeed Insights is not necessarily the location from which the Lighthouse test is executed. According to Google’s PageSpeed Insights documentation, the test runs in a Google data center and may report a location in North America, Europe or Asia depending on network conditions. The actual region can be checked in the Lighthouse report’s environment information.
This matters when latency to the origin server is significant. A PageSpeed result and a test deliberately executed from another region are not necessarily equivalent measurements even when they test the same URL.
Use GTmetrix when location and connection conditions need to be controlled
GTmetrix provides multiple test locations and allows connection, browser and device conditions to be selected. This makes it useful when the question is not simply “Is this page fast?” but “How does this page behave for a visitor under a specific network and geographic scenario?”
For example, a WordPress site serving primarily users in Switzerland or Germany can be tested from a European location and then retested from North America while keeping the browser and connection profile unchanged. The difference can expose latency, CDN or origin-location effects that are difficult to see from a single synthetic test.
GTmetrix also supports analysis presets, which are useful for saving a repeatable combination of location, device and connection settings. Reusing the same preset makes before-and-after measurements substantially easier to compare.
Use Chrome DevTools to find the actual bottleneck
Once a problem can be reproduced, Chrome DevTools can show where the time is being spent.
The Network panel exposes the request waterfall: when HTML, CSS, JavaScript, fonts, images and third-party resources were requested, how long they took and whether caching or request priority affected the result.
The Performance panel adds the browser’s runtime perspective. It can display local LCP and CLS, record INP as the page is used, and show interactions, layout shifts and main-thread activity. This is particularly useful when a site loads quickly but feels slow after the visitor begins interacting with it.
Recent Chrome DevTools versions can also display CrUX field metrics alongside local measurements when field data is available. That makes it easier to compare “what happened on this machine” with “what eligible real users have experienced.”
Measure TTFB separately when the backend or cache is in question
When the suspected bottleneck is the initial document response, a simple command-line request can be useful because it removes most of the visual complexity of a full browser test.
curl -o /dev/null -s -w "TTFB: %{time_starttransfer}s TOTAL: %{time_total}s\n" https://example.com/On Windows, the executable can be called explicitly as curl.exe.
The reported time_starttransfer should not be interpreted as pure PHP or database execution time. It is the time from the test client until the first response byte arrives, so network setup and latency are also part of the measurement. Its value is in comparison: repeated tests can reveal large differences between cached and uncached responses or between testing locations.
Make before-and-after tests comparable
A performance comparison becomes difficult to trust when several test conditions change at the same time. Before evaluating an optimization, keep as many variables as possible constant.
- Test the same URL and template.
- Keep the same test location, device and connection profile.
- Use a logged-out or clean browser state when testing the public visitor experience.
- Record whether the response is cached, uncached or intentionally cache-warmed.
- Keep consent state consistent when analytics, advertising or other scripts depend on user consent.
- Run several tests rather than selecting the single fastest result. A median of repeated runs is usually more representative than the best run.
- Change one significant variable at a time whenever possible.
- Recheck functionality after optimization, especially menus, forms, consent controls and other interactive components.
These rules are especially important when comparing caching, CDN changes, image delivery, JavaScript optimizations or server configuration. If the test conditions changed at the same time as the website, it becomes much harder to identify which change produced the result.
Case study: why a PageSpeed score of 100 can still hide a measurable improvement
A test performed on SEO Expert provides a useful example of why several measurements are more informative than one headline score.
Before full-page caching was enabled, repeated command-line requests showed a Time to First Byte of approximately 0.77–0.88 seconds. A controlled GTmetrix test from Seattle using a throttled 3G profile produced an LCP of approximately 3.2 seconds. At the same time, PageSpeed Insights already reported a mobile Performance score of 100.
After full-page caching was enabled, command-line TTFB dropped to approximately 0.17–0.20 seconds. Repeated GTmetrix tests under the same general geographic and network conditions produced a median LCP of approximately 2.6 seconds. The PageSpeed mobile Performance score remained 100.
| Measurement | Before full-page cache | After full-page cache |
|---|---|---|
| TTFB | ≈ 0.77–0.88 s | ≈ 0.17–0.20 s |
| GTmetrix LCP | ≈ 3.2 s | ≈ 2.6 s median |
| PageSpeed mobile Performance | 100 | 100 |
This does not mean that PageSpeed Insights was wrong. The Lighthouse score was already at the top of its scale under its own test conditions, so the headline score had little room to communicate the size of the backend improvement. Direct TTFB measurement and a controlled throttled test made the difference much easier to observe.
The lesson is not that one tool is better than another. It is that each tool answers a different question. Field data tells you whether real users have a problem. Controlled tests help reproduce it. Network and runtime traces help explain it. Raw response measurements help isolate the server and cache path.
Common Core Web Vitals optimization mistakes
Chasing a score of 100
A high Lighthouse score is useful, but it is not a business objective by itself. The final few synthetic points can require compromises that produce no meaningful improvement for users.
Optimize measurable bottlenecks, not the emotional discomfort of seeing 97 instead of 100.
Lazy-loading the LCP image
Lazy loading is valuable for images below the fold. Applying it to the main above-the-fold image can delay the exact resource LCP is waiting for.
Delaying every JavaScript file
Broad delay rules can make a report look cleaner while moving problems into user interaction. A menu, form or consent tool that initializes only after the visitor clicks may create a new responsiveness problem or fail completely.
Installing another optimization plugin before finding the cause
Performance plugins can be extremely useful, but stacking multiple tools without understanding responsibility can create duplicated minification, conflicting caches, broken exclusions and difficult debugging.
Measure first. Then choose the smallest intervention that solves the measured problem.
Testing only after the cache is warm
Repeated tests can create an unrealistically favourable picture. Include fresh sessions and uncached server requests when investigating backend performance.
A practical WordPress Core Web Vitals audit
- Record the current field metrics. Note LCP, INP and CLS separately for mobile and desktop.
- Identify the affected templates. Do not assume the homepage represents the whole site.
- Run controlled lab tests. Use them to find resource, rendering and main-thread bottlenecks.
- Check Time to First Byte. Separate server delay from front-end delay.
- Inspect the LCP element. Determine whether the delay is server response, discovery, transfer or rendering.
- Test interactions. Pay particular attention to navigation, forms, consent and interactive widgets.
- Record layout shifts. Identify the actual elements that move instead of guessing from the final CLS number.
- Audit theme and plugin assets. Check what is loaded globally and whether it is required on each template.
- Compare cold and warm behaviour. Verify what the cache is hiding as well as what it improves.
- Deploy one controlled change at a time. Re-test functionality as well as performance.
- Monitor field data after deployment. Remember that Search Console reflects real-user data over time rather than an instant retest.
What if Search Console has no Core Web Vitals data?
Small or new websites may not have enough eligible real-user observations for a URL or URL group to appear in the Core Web Vitals report. The absence of data does not mean the pages are fast, slow or broken; it can simply mean the reporting threshold has not been reached.
In that situation, laboratory testing becomes more important for diagnosis, and site owners can also consider collecting their own real-user performance measurements if the project justifies it.
Search Console should therefore be treated as one source of evidence rather than as the only performance monitoring system.
Frequently asked questions
What are the Core Web Vitals for WordPress?
WordPress uses the same Core Web Vitals as every other web platform: Largest Contentful Paint (LCP), Interaction to Next Paint (INP) and Cumulative Layout Shift (CLS). WordPress affects how those metrics behave through its server processing, themes, plugins, media and front-end assets, but the metrics themselves are platform-independent.
Why does Lighthouse show 100 while Search Console reports a problem?
Lighthouse is a synthetic test of one page load under controlled conditions. Search Console Core Web Vitals is based on aggregated real-user experience. Real devices, networks, interactions and historical measurements can therefore produce different results.
Which tools should I use to test WordPress Core Web Vitals?
Use different tools for different questions. Search Console and CrUX show whether eligible real users are experiencing Core Web Vitals problems. PageSpeed Insights and Lighthouse provide controlled laboratory diagnostics. GTmetrix is useful when you need to control location, device and connection conditions. Chrome DevTools helps identify request, rendering and interaction bottlenecks. Direct TTFB measurements can help isolate server-response and caching differences.
Does caching fix Core Web Vitals?
Caching can substantially improve server response time and loading performance, but it does not automatically solve every Core Web Vitals problem. Client-side JavaScript, poor interaction responsiveness, layout shifts and third-party scripts can remain even when HTML is served instantly from cache.
How long does Search Console take to reflect a Core Web Vitals fix?
Core Web Vitals reporting is based on real-user data collected over a rolling 28-day period. A successful technical fix can therefore appear immediately in a lab test while Search Console changes gradually as new field observations replace older data.
Should I optimize for mobile or desktop first?
Both matter, but mobile frequently exposes performance problems more clearly because processing power, memory and network conditions are more constrained. Diagnose the actual audience and field data rather than assuming desktop results represent mobile users.
Can a WordPress plugin improve all three Core Web Vitals automatically?
No single optimization can reliably solve every cause of LCP, INP and CLS. A plugin may improve caching, images or asset delivery, but server workload, theme architecture, JavaScript behaviour, third-party code and layout construction still need to be diagnosed individually.
The goal is not a score — it is a reliably fast experience
Core Web Vitals become much more useful once the discussion moves away from “How do I get 100?” and toward “What is making this experience slower or less stable for real users?”
For WordPress sites, that means looking at the whole delivery path: server response, database work, caching, images, fonts, CSS, JavaScript, theme architecture, plugins and third-party services. It also means testing the things visitors actually do rather than evaluating only the moment a page first appears.
A strong PageSpeed score is worth having. Good Core Web Vitals are worth pursuing. Neither should become a substitute for diagnosis.
The most effective optimization is usually the one that removes unnecessary work while preserving the functionality the website actually needs. When that is done well, the result is not simply a greener report. It is a WordPress site that loads predictably, responds quickly and remains stable across the devices and conditions its visitors really use.
Primary sources
- Google Search Central — Core Web Vitals and page experience documentation
- Google Search Console Help — Core Web Vitals report
- Google for Developers — About PageSpeed Insights
- web.dev — Web Vitals
- web.dev — Largest Contentful Paint (LCP)
- web.dev — Interaction to Next Paint (INP)
- web.dev — Cumulative Layout Shift (CLS)
- Chrome for Developers — Performance panel
- GTmetrix — Test Server Locations
- GTmetrix — Analysis Presets
Which Core Web Vital is hardest for you to improve?
Results
0 confirmed votes